
Dashboards are very critical for businesses of all sizes. They enable stakeholders to visualize data at a particular time frame on a single screen (in most cases). The important point to be noted here is that they are being used for seeking information at a given point in time.
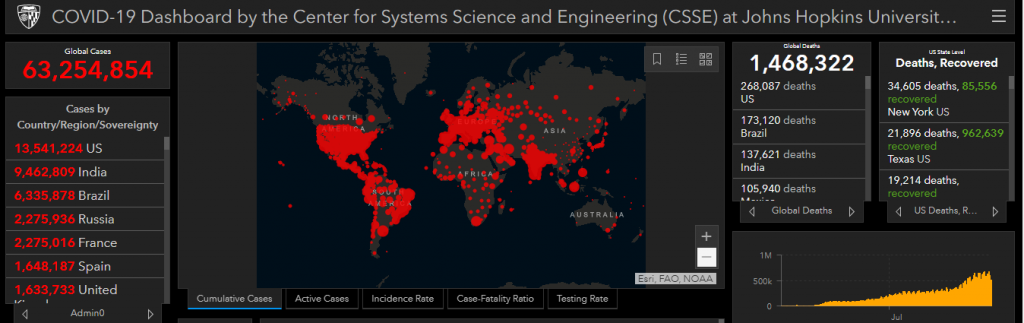
Even in the time of the pandemic, John Hopkins Coronavirus Dashboard is our go-to place, to know the status of cases in the world. Though I must say the dashboards can definitely answer the question “how many new cases were there today in my country?”, but you will not be able to find answers to questions like – when did social distancing measures start in my country/ county? How easily are tests available in my country?
Having said that, I do not want to claim that Dashboards are dead or they are in the later stages of life. But at the same time, the reality is Dashboards are not driving adoption ( adoption rate is only 30% as per a report by Gartner).
So here are my 5 key reasons why Dashboards are failing Adoptions
- One Size Fits All approach: Dashboards are built keeping in mind a specific business use case rather than stakeholders. Practically speaking, that is the right approach, because developing a fully functional dashboard takes anywhere from 4-6 weeks. But as a result, it does not fulfill anyone’s business need, therefore the never ending feedback loop.
- The never-ending feedback loop: There are two reasons for never-ending feedback loops. Firstly, dashboards are not personalized to any particular person and the stakeholders’ priorities keep changing. The second reason being the lack of communication between the stakeholder and the business analytics (well this is something that can be optimized).
- Even with 1000 filters, it lacks Depth and Breadth: Without purpose, data visualization can give no data story, therefore the request of the addition of filters. And soon the 2-page dashboard has turned into 67 pages. It increases the loading time to the nth period, thus losing the depth and increasing the complexity of the dashboard.
- Increasing Data Sources: With the rise of digitalization and IoT, the speed at which the data is increasing is also exponential. It is claimed that 95Z GB data will be generated by 2025 from IoT devices only. Connecting to Live and multiple data sets at the same time increases complexity and with iteration are prone to errors. Therefore, the dashboards’ insights have a higher probability of being declared as bad data, which is even more difficult to cross verify.
- Not able to establish ROI: As humans, we often tend to weigh the utility of products before using it. Therefore a normal calculation that you would do in your head is how much time it will take for me to open the dashboard and find an insight viz-a-viz to download the excel and find it for myself. Generally, the second one wins. This is not only because it takes less time but also we trust ourselves more than others.
Now the next big question is if Dashboards are not able to get adoption, then what?
Dashboards were built to get people to use data, but now is the time to reimagine how data is consumed. It’s time to get data to the people in the most comfortable environment.
Beagle might be a good option for you to explore. A personal Virtual Analyst, that provides you instant byte-size information in the form of cards. Its advanced domain data mapping and built-in advanced analytics module make it a go-to platform for all your data analysis needs.