
According to Gartner, by 2025, data stories will be the most widespread way of consuming analytics, and 75% of stories will be automatically generated, using augmented analytics techniques.
Modern analytics have developed a new surge of BI platforms and organizations are moving towards data visualization. This has resulted in a growing market of Business intelligence platforms, that are easy-to-use and can support full analytics workflow from data preparation to visualization and insight generation.
Based on these characteristics, each year Gartner comes up with a Magic Quadrant for analytics and business intelligence platforms.
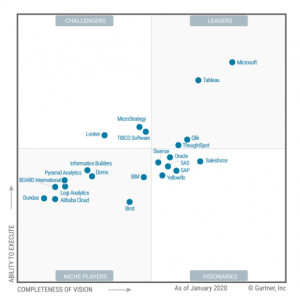
Microsoft Power BI and Tableau have been the market leaders from a long time now and are often the first choices of the organization.
But then comes the bigger question, Tableau or Power BI?
Though the debate on which one is better is endless, let me give you some key practical points that will make it easy for you to select the right tool for your business.
If in case you are at early stage digital adoption where you are trying to identify a BI tool for your organization then you should first look at 9 things to look for before selecting a BI tool for your company in 2021
Data Visualization
If your primary purpose is to get some amazing data visualization then Tableau is the way ahead. It provides an option of approx 24 in-built charts to develop any powerful and complex dashboard visualization with simple drag and drop feature.
Power BI does provide a set of charts for data visualization though the in-built charts are limited. But if you know R, the platform does allow you to create R script visuals. Having said that, it’s important to note that the core strength of the platform lies in data manipulation, reporting, and data modeling.
Integration to Data Sources
Both Power BI and Tableau allow you to connect to various data sources with the help of API’s. Tableau has invested heavily on the connectors but if your complete data stack is on Azure, Power BI might be a better option. Power BI being a Microsoft product comes with a built in connection to Microsoft systems like Azure, SQL and Excel. But Tableau allows you to view all the connected data sources in your account, in your dashboard itself.
If you want to do some intensive cross data analysis, both the platforms allow you to do that. But here the only catch is that you need good programming skills otherwise it can be a challenge. Of course, if you use Beagle then that is definitely not a problem. (Beagle allows you to connect different data sources in one analytics flow and develop data harmony).
Dashboard:
Power BI is built with the idea of quick visualization. It allows real-time data access and drag-and-drop feature. The platform tries to display the idea of low or no code, so that people with no prior knowledge can effectively use the platform. But in reality it does require a level of basic training to use even the basic features.
Though Tableau does have a strong visualization capability, it is a little tedious to use, as most of the features are hidden inside different menus. Tableau gives you live query capabilities and extracts, which is particularly helpful for data analysts who are used to stopping all work for the query process.
Ease of Use:
Power BI has a more intuitive interface and is much simpler to learn than tableau. It is due to its simplicity and ease of use, that business users prefer Power BI more. Tableau does not have a very intuitive UI but gives a lot of scope for Power User to explore.
Pricing
If you are looking for an affordable and value for money BI solution for your organization then Power BI is the platform for you. A typical Tableau Viewer would cost around $12* per user per month for a min of 100 users, whereas Power BI would cost you $9.99** per user per month. The cost difference between both the platforms is significantly high so if you are just starting with dashboarding in the organization then you can simply start with Power BI.
PS: Beagle integrates with all your data sources at a much lower cost. Contact us to know the cost
So above are some of the key parameters that you might want to evaluate both Power BI and Tableau on.
Having said that, let me conclude by saying it’s important for you to identify the purpose of the BI tool. If you want a tool that can help you with your daily reports with amazing visuals, then go with Tableau, but if the purpose is an advanced analytics, then Power BI will be a better choice.
One critical aspect to understand here is irrespective of which BI tool you select, the users would require to go through a round of extensive training sessions before using it. Without training, it would be difficult to increase the usage of the tool unless you plan to use tools like Beagle.